
US Housing Market Trends by City in 2026 : 10 Cities Where Home Values Are Up


Share:
Table of Contents
As the housing market moves into a new phase, national averages no longer tell the full story. US housing market trends by city in 2026 reveal a sharply divided landscape, where some metros continue to see rising home values and intense competition, while others are cooling with slower sales and increased price adjustments. With inventory levels, buyer demand, and mortgage rates shifting at different speeds across regions, understanding how local markets are performing has become essential for buyers, sellers, and real estate professionals navigating the year ahead.
1. The National Picture: US Housing Market Trends in 2025
Across the country, US housing market trends by city in 2025 are being shaped by a growing supply of homes and a noticeable shift in seller behavior. While the average U.S. home value is holding steady at roughly $362,000,showing little change from the previous year, this stability masks mounting pressure in many local markets as affordability remains a key challenge for buyers.
Housing inventory has expanded significantly, with active listings in October running nearly 13% higher than the same period last year. Buyers now have more options than they’ve seen in recent years, and properties are spending more time on the market, averaging close to four weeks before going under contract. This slower pace has prompted many sellers to reassess their pricing strategies.

Recent data indicates that more than a quarter of sellers nationwide reduced their asking prices in October, with certain metros seeing discounts on over one-third of listings. Cities such as Indianapolis, Raleigh, Salt Lake City, Denver, Columbus, and Phoenix have recorded some of the most aggressive price adjustments, reflecting softer demand and increased competition among sellers.
At the same time, bidding wars have become less common. The share of homes selling above list price has declined compared to last year, signaling a market that is gradually rebalancing. Mortgage rates have also inched down, averaging around 6.25% in October, which has slightly improved purchasing power for well-prepared buyers. Even so, economists expect rates to remain above the 6% mark in the near term, reinforcing the importance of local market dynamics as buyers and sellers head into 2026.
2. Buyer vs Seller Markets Across US Cities
Despite signs of balance at the national level, housing conditions across major U.S. metros remain far from uniform. In some cities, limited inventory and steady demand continue to favor sellers, while in others, buyers are gaining leverage as listings accumulate and competition cools.
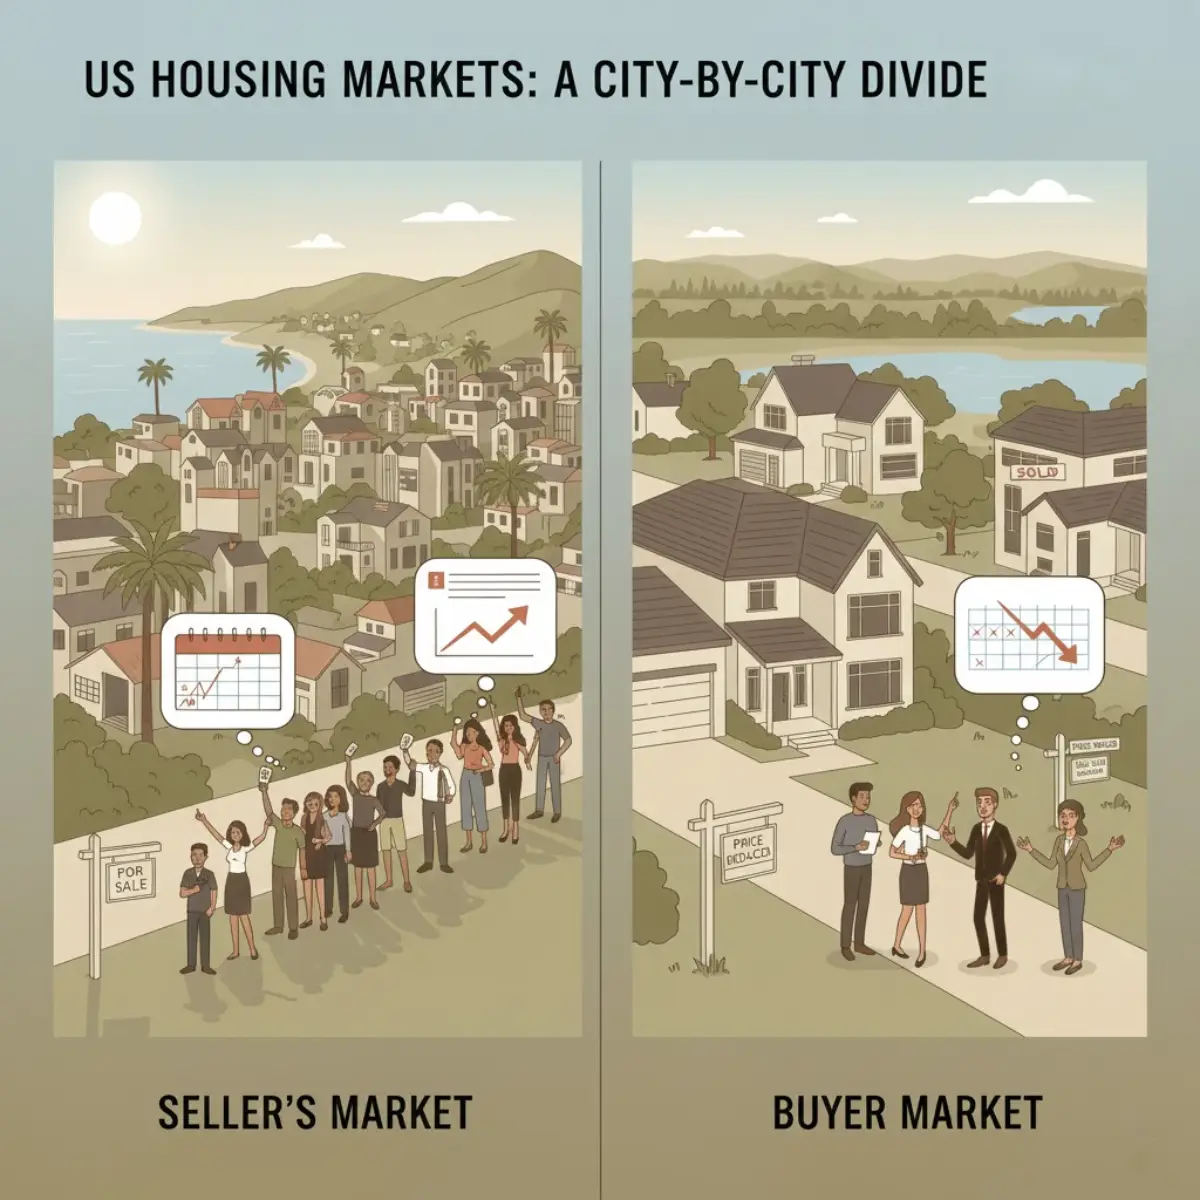
Several large markets in the Northeast and coastal California still show characteristics of seller-leaning environments. Homes in these areas tend to attract interest quickly, and pricing remains relatively firm compared to much of the country. By contrast, a growing number of metros, particularly in the South and parts of the Sun Belt, have shifted toward buyer-friendly conditions, marked by longer days on market and more frequent price negotiations.
This divergence underscores why US housing market trends by city in 2026 cannot be understood through national averages alone. Local supply dynamics, migration patterns, and affordability pressures are increasingly shaping whether buyers or sellers hold the advantage in a given market. For anyone navigating real estate decisions in the year ahead, recognizing these city-level differences has become essential.
3. Metros where home prices have changed the most
Real estate conditions vary widely, with some markets favoring sellers, others leaning toward buyers, and many landing somewhere in between. According to Zillow’s Market Heat Index, buyer and seller leverage is now balanced at the national level, a clear shift away from the seller-dominated environment seen earlier in the decade, reflected in largely flat home prices.
Zillow forecasts that U.S. home values will finish 2025 roughly where they began, with limited price movement in the short term. Modest growth is expected to return in 2026, peaking at just under 2% by late summer.
National averages, however, mask sharp local differences. Among the 100 largest U.S. metros, only nine currently qualify as strong seller markets, primarily in parts of the Northeast and California, while more than 30 metros now favor buyers, particularly across the South and Midwest.
Against this backdrop of diverging local conditions, certain metros have seen the largest gains or declines in home values, highlighting how uneven the housing market remains across the country.
| Seller - Favored markets (Strong seller conditions) | Seller - Favored markets (Buyer Advantage) |
|
|
3.1. U.S. Metros Showing the Strongest Monthly Growth in Home Values
The data suggests that US housing markets in 2026 by city are showing modest but resilient month-over-month gains, particularly in high-value metros with structurally strong demand. San Jose and New York lead the group with MoM increases of 0.42% and 0.38%, underscoring continued buyer interest in major technology and economic hubs where supply remains constrained. San Francisco and Los Angeles are posting smaller gains, signaling a more balanced phase after prior price corrections. Meanwhile, Salt Lake City and Providence stand out as mid-priced metros maintaining positive momentum, indicating that price growth in US housing markets in 2026 by city is not limited to coastal giants but is gradually spreading to secondary markets offering relative affordability and stable demand fundamentals.

|
Metro |
Typical home value as of October 31, 2025 |
MoM % change in value |
|
San Jose, CA |
$1,572,103 |
0.42% |
|
New York, NY |
$709,052 |
0.38% |
|
San Francisco, CA |
$1,107,255 |
0.10% |
|
Salt Lake City, UT |
$560,475 |
0.07% |
|
Los Angeles, CA |
$949,365 |
0.04% |
|
Providence, RI |
$506,874 |
0.04% |
|
Boston, MA |
$721,320 |
-0.01% |
|
Riverside, CA |
$580,718 |
-0.02% |
|
Chicago, IL |
$338,938 |
-0.02% |
|
Washington, DC |
$575,078 |
-0.04% |
Read more: Real estate 2026 predictions
3.2. Metros Experiencing the Sharpest Month-to-Month Declines in Home Values
This group of metros highlights where price pressure is easing most noticeably, offering important context for readers tracking US housing markets in 2026 by city. The sharpest month-to-month declines are concentrated in fast-growth Sun Belt markets like Austin, Dallas, San Antonio, Atlanta, and Las Vegas, where inventory has risen and demand has cooled after years of rapid appreciation. Several of these areas are clearly shifting toward buyer vs seller housing markets US, with buyers gaining more leverage as sellers adjust expectations. Together, these declines don’t signal a nationwide downturn, but rather a localized recalibration that helps readers distinguish between short-term corrections and longer-term market fundamentals.
|
Metro |
Typical home value as of October 31, 2025 |
MoM % change in value |
|
Austin, TX |
$426,454 |
-1.04% |
|
Pittsburgh, PA |
$221,717 |
-0.91% |
|
Dallas, TX |
$362,053 |
-0.67% |
|
San Antonio, TX |
$276,411 |
-0.64% |
|
Atlanta, GA |
$378,785 |
-0.58% |
|
Las Vegas, NV |
$429,719 |
-0.56% |
|
Raleigh, NC |
$435,449 |
-0.56% |
|
Houston, TX |
$305,280 |
-0.54% |
|
Columbus, OH |
$322,398 |
-0.52% |
|
Buffalo, NY |
$277,334 |
-0.50% |
3.3. Metros Leading the Nation in Annual Home Value Growth
In contrast to markets seeing short-term pullbacks, these metros are setting the pace for US housing market trends on an annual basis, showing where demand remains structurally strong. Much of the year-over-year growth is concentrated in Midwestern and Northeast cities, where affordability, stable job markets, and limited housing supply continue to support price gains. These locations clearly represent cities where home values are rising, even as other regions experience moderation. From a competitive standpoint, many of these metros still lean toward seller-favorable conditions, underscoring how buyer vs seller housing markets in the US can vary dramatically by city and reinforcing the importance of tracking home value trends by city rather than relying on national averages.
|
Metro |
Typical home value as of October 31, 2025 |
YoY% change in value |
|
Cleveland, OH |
$241,368 |
4.53% |
|
Hartford, CT |
$382,321 |
4.38% |
|
Milwaukee, WI |
$370,525 |
4.05% |
|
Buffalo, NY |
$277,334 |
3.74% |
|
Chicago, IL |
$338,938 |
3.70% |
|
Detroit, MI |
$260,188 |
3.40% |
|
Louisville, KY |
$270,566 |
3.19% |
|
New York, NY |
$709,052 |
3.09% |
|
Cincinnati, OH |
$298,945 |
2.92% |
|
Philadelphia, PA |
$377,765 |
2.70% |
3.4. U.S. Cities with the Steepest Year-Over-Year Decreases in Home Values
Rounding out the picture of US housing market trends, these metros highlight where price corrections have become more pronounced over the past year. Many of the steepest declines are concentrated in Sun Belt and high-growth pandemic-era markets, where rapid appreciation has given way to softer demand and increased inventory. These areas now stand out as cities where home values are falling, signaling a clear shift in local momentum. In several of these metros, negotiating power has tilted toward buyers, reinforcing how buyer vs seller housing markets US can flip as conditions normalize and emphasizing why close attention to home value trends by city is essential when evaluating market opportunities.
|
Metro |
Typical home value as of October 31, 2025 |
YoY % change in value |
|
Austin, TX |
$426,454 |
-6.10% |
|
Tampa, FL |
$356,298 |
-6.09% |
|
Miami, FL |
$470,828 |
-4.79% |
|
Orlando, FL |
$384,931 |
-4.55% |
|
Dallas, TX |
$362,053 |
-4.02% |
|
Jacksonville, FL |
$347,020 |
-3.40% |
|
Phoenix, AZ |
$444,548 |
-3.36% |
|
San Antonio, TX |
$276,411 |
-2.97% |
|
Atlanta, GA |
$378,785 |
-2.92% |
|
Denver, CO |
$566,597 |
-2.92% |
4. What These Shifts Mean for Buyers and Sellers in 2026
Taken together, these patterns underscore how fragmented the US housing market trends have become heading into 2026. Rather than a single national narrative, outcomes increasingly depend on home value trends by city and the local balance of supply and demand.
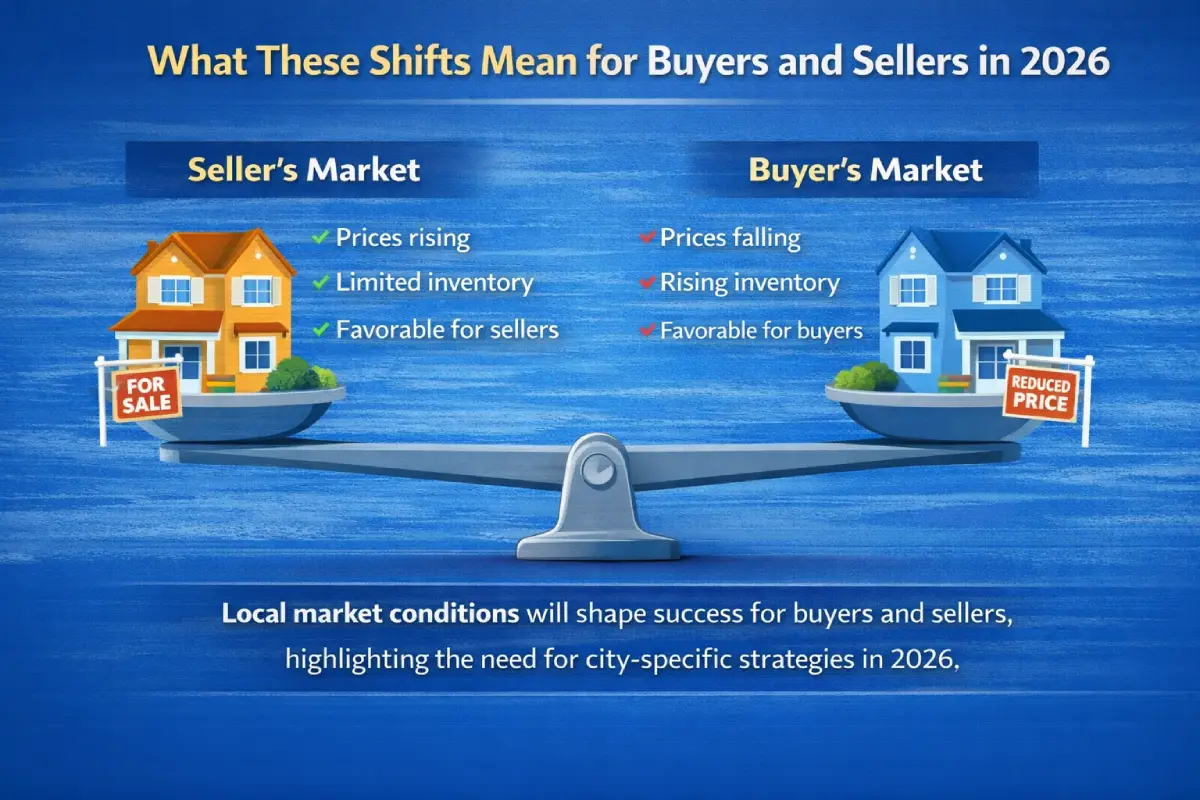
In metros where prices are still climbing year over year, sellers continue to benefit from limited inventory and steady buyer interest, even as appreciation moderates. These remain cities where home values are rising, often favoring well-priced, move-in-ready properties. By contrast, markets experiencing sustained declines are firmly transitioning into cities where home values are falling, giving buyers greater leverage through price negotiations, concessions, and longer decision timelines.
This divergence reinforces the importance of understanding buyer vs seller housing markets US at the metro level. For buyers, 2026 presents growing opportunities to re-enter markets that were previously out of reach. For sellers, success will increasingly depend on realistic pricing, strong presentation, and local market awareness rather than relying on broad national trends.
For sellers, you need to upgrade your marketing on your channels with images and videos of your properties to attract buyers' attention. This is the key to differentiating yourself and competing with other sellers in the home buying process.
Read more: Real estate visual marketing
5. Why Home Prices Rise or Fall, And How to Prepare in 2026
Understanding why home prices move differently from one neighborhood to another is essential when navigating the US housing market trends. While national indicators set the backdrop, real outcomes are driven by highly localized forces that shape home value trends by city.
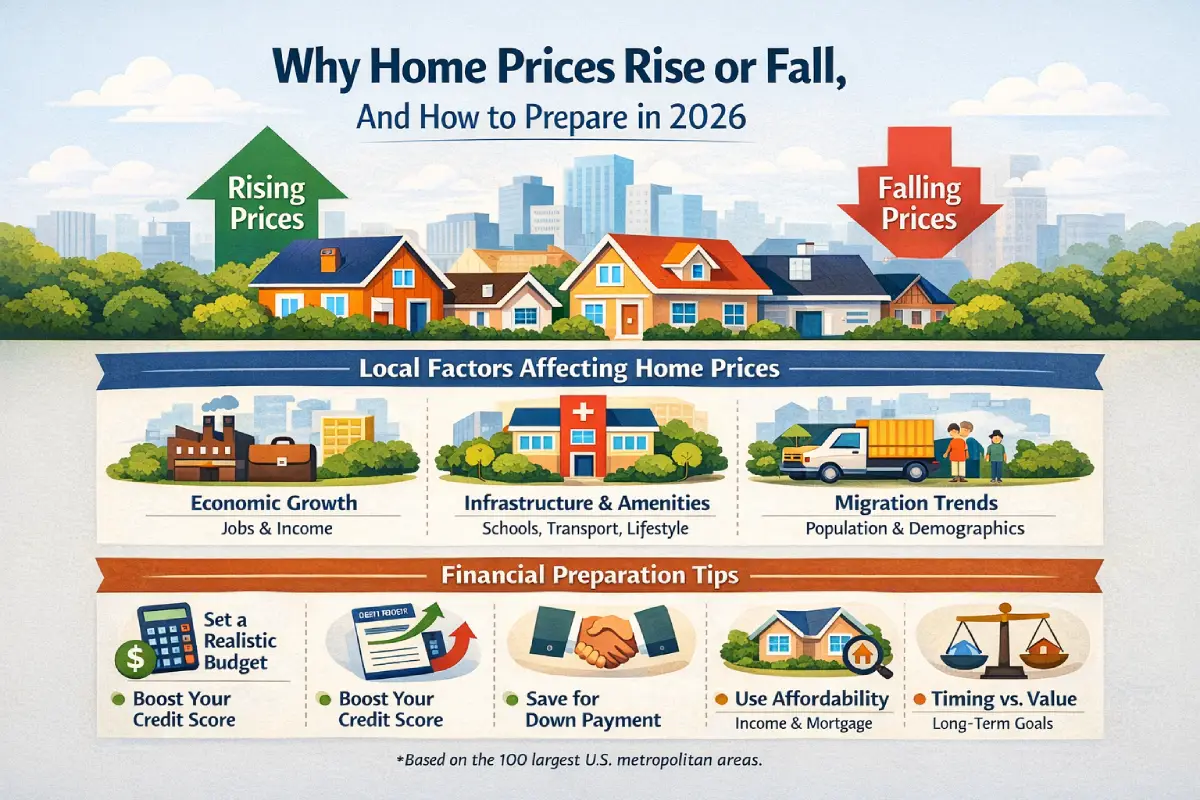
5.1. What drives price changes at the local level?
Several factors influence whether a metro becomes one of the cities where home values are rising or shifts into a market where prices soften:
-
Economic strength and employment growth
Areas with expanding industries, job creation, and income growth tend to attract new residents, increasing housing demand and supporting higher prices. -
Infrastructure and quality-of-life amenities
Investments in transportation, schools, healthcare, and lifestyle amenities often make certain metros more desirable, allowing sellers to command a premium. -
Demographic and migration patterns
Population growth, inbound migration, and younger buyer demographics can push demand higher, while slowing growth or outbound migration may contribute to cities where home values are falling.
Read more: Real estate video editing
5.2. How to prepare financially in a shifting market
Regardless of whether you’re buying in a buyer-leaning or seller-leaning metro, financial readiness matters. Start by defining a realistic budget and strengthening your credit profile. Consistent on-time payments, keeping credit utilization low, avoiding unnecessary new accounts, and correcting credit report errors can significantly improve borrowing power.
Affordability tools that factor in income, credit score, and current mortgage rates can also help clarify which homes fit your financial situation in today’s buyer vs seller housing markets US.
5.3. Why local expertise matters more than timing
There is no universally “perfect” moment to buy or sell. Even seasoned investors struggle to time the market precisely. What matters more is understanding how local trends affect pricing, competition, and negotiation dynamics.
A knowledgeable agent can interpret neighborhood-level data, helping you assess whether waiting may increase costs or whether current conditions offer leverage. Using the trends above as a discussion framework allows you to make informed decisions that align with both market realities and personal goals.
*Based on the 100 largest U.S. metropolitan areas.
6. Conclusion
As the market moves into a new cycle, one thing is clear: US housing market trends by city in 2026 are defined far more by local dynamics than by national averages. While some metros continue to see steady appreciation, others are experiencing meaningful corrections that reshape buyer and seller expectations. Understanding these city-level differences, from shifts in supply and demand to changing affordability and competition, is essential for making smart real estate decisions. Whether you’re buying, selling, or simply monitoring the market, staying focused on localized data and realistic pricing will be key to navigating opportunities and risks in the year ahead.
Follow Fotober Media:
- Facebook: fotobermedia.co
- Youtube Channel: Fotober
- TikTok Channel: @fotober
- Instagram: fotober_media
- Email support: [email protected]
- Hotline: +84 942 110 297
Related posts

Double Your Booking: Airbnb Photography Tips for World Cup Host Cities
July 15, 2026

The Legacy of Sam Neill Real Estate: Vineyard & His Private Sanctuary
July 14, 2026

World Cup 2026 Host City Real Estate: Overview & Marketing Strategies
July 13, 2026

Most Common Photography Mistakes California Realtors Should Avoid
July 10, 2026
